Soil Liquefaction: Factor of Safety, Calculations, and Simplified Procedures
Courses > Soil Mechanics > Advanced Soil Mechanics Topics > Soil Liquefaction: Factor of Safety, Calculations, and Simplified Procedures Introduction
Liquefaction occurs in a saturated sandy soil when deformation during undrained or partially drained conditions produces a buildup in pore water pressure to a level that approaches or equals the total confining pressure. At this point the effective confining pressure is zero or near zero, and the soil will continue to deform until enough water has been squeezed from the soil to dissipate a substantial portion of the excess pore water pressure. Liquefaction may occur from either static strains induced from monotonic loading (e.g. Casagrande 1936) or from cyclic strains induced by dynamic or vibratory loading (e.g. Lee and Seed 1967a). Damage to buildings caused by static liquefaction is rare, but possible.
 Concepts and Formulas
Effects of Soil Liquefaction
One of the most dramatic causes of damage to structures during earthquakes is the occurrence of liquefaction in saturated sand deposits. Loose sand tends to contract under the cyclic loading imposed by earthquake shaking, which can transfer normal stress from the sand matrix onto the pore water if the soil is saturated and largely unable to drain during shaking. The result is a reduction in the effective confining stress within the soil and an associated loss of strength and stiffness that contributes to deformations of the soil deposit.
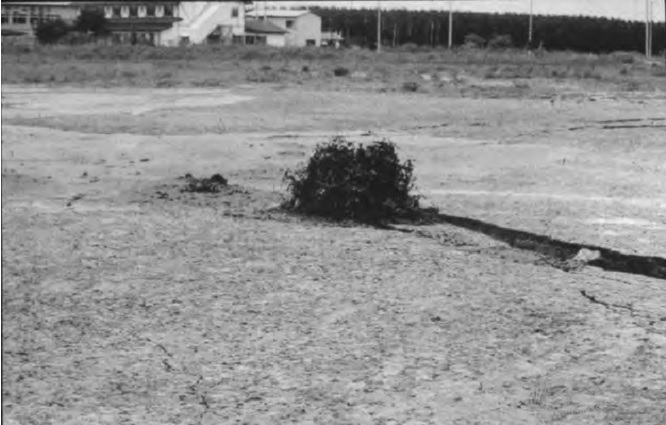
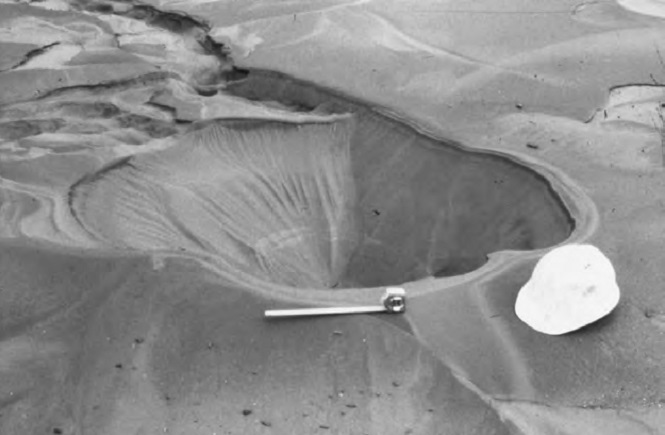
A common manifestation of liquefaction is the formation of sand boils or mud spouts at the ground surface by seepage of water through ground cracks or, in some cases, by the development of quicksand like conditions over substantial areas. The first figure below shows sand boiling along a fissure in the ground caused by an earthquake, and the second figure shows a sand boil after the liquefaction-induced boiling has ceased. The damage from liquefaction is seldom, however, due to the sand boils themselves, but rather due to the loss of strength and stiffness in the soils that have liquefied and the associated ground deformations that ensue.
Examples of Soil Liquefactions
Extensive damage can occur to buildings and other engineered structures during earthquakes owing to liquefaction in saturated sandy soils beneath the structures. For example, hundreds of buildings were severely damaged as a result of liquefaction during the 1964 earthquake in Niigata, Japan (Seed and Idriss 1967). Many structures settled more than 3 ft (0.9 m), and the settlement was frequently accompanied by severe tilting (up to 80 degree). Lateral ground displacements generated during earthquakes by liquefaction-induced lateral spreads and flows have also caused severe damage to structures and their appurtenances (Youd 1993).
Furthermore, liquefaction can occur from lower levels of excitation produced by other phenomena, including blasting, pile driving, construction equipment, road and train traffic, and dynamic compaction (Carter and Seed 1988). Thus all structures underlain by saturated sand deposits may be susceptible to liquefaction-induced damage, and it is imperative that liquefaction potential be considered for these cases even when the site is not located in a
seismically active region.
Liquefaction Categories
- Complete Liquefaction- when a soil exhibits no resistance or negligible resistance over a wide range of strains (e.g. a double amplitude of 20%).
- Partial Liquefaction- when a soil exhibits no resistance to deformation over a strain range less than that considered to constitute failure.
- Initial Liquefaction- when a soil first exhibits any degree of partial liquefaction during cyclic loading.
Soil Liquefaction Analysis/Factor of Safety
Three possible methods have been used to various extents for estimating liquefaction potential (Youd 1993): (1) Analytical methods, (2) physical modeling, and (3) empirical procedures. Because it is difficult to model the soil conditions at liquefiable sites either analytically or physically, empirical procedures are commonly used in routine engineering practice. A complete discussion of methods for evaluating liquefaction potential for all types of cyclic loading is beyond the scope of this article, so details are given below only for earthquake-induced liquefaction.
The factor of safety against the occurrence of earthquake-induced liquefaction is commonly defined as the available soil resistance to liquefaction (expressed in terms of the cyclic stresses required to cause liquefaction) divided by the cyclic stresses generated by the design event (Youd 1993). Both factors are usually normalizedwith respect to the pre-event effective overburden stress at the depth being analyzed. In equation form, the factor of safety is defined as
where
CRR = cyclic resistance ratio (cyclic stress ratio required to generate liquefaction)
CSR = cyclic stress ratio generated by the design earthquake = τav / σ'v0
τav= average earthquake-induced cyclic shear stress
σ'v0 = pre-earthquake effective overburden stress at the depth under consideration
CSR can evaluated either by using a computer code (such as SHAKE or DESRA) to estimate τav, or by estimating it directly from the following equation:
where
amax = maximum acceleration at the ground surface that would occur in the absence of liquefaction
g = acceleration caused by gravity
σv0 = total overburden stress at the depth under consideration
rd = depth-related stress reduction factor that varies with depth (z) from the ground surface
rd can be estimated from the following equation for noncritical projects (NCER 1997):
rd = 1 - 0.00765*z for z <= 0.15 m
rd = 1.174 – 0.0267*z for 9.15 m < z <= 23 m
rd = 0.744 – 0.008*z for 23 m < z <= 30 m
rd= 0.50 for z > 30 m
Estimated values for max are usually determined using one of the following three methods (Youd 1993): (1) Standard peak acceleration attenuation curves that are valid for comparable soil conditions; (2) standard peak acceleration attenuation curves for bedrock sites, with correction for local site effects using standard site amplification curves or using computerized site response analysis; and (3) probabilistic maps of amax, with or without correction for site attenuation or amplification depending on the rock or soil conditions used to generate the map.
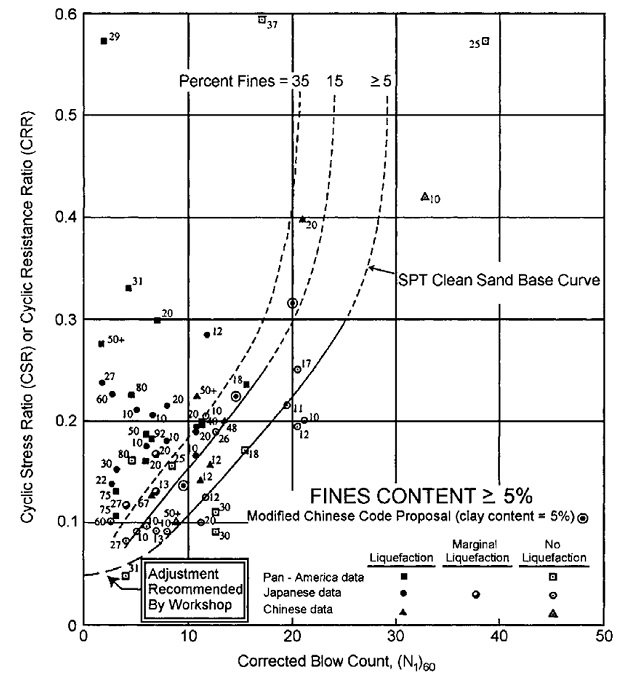
CRR is most commonly estimated from empirical correlations with corrected SPT blow count [(N1)60] such as those shown in Fig. below which are valid for magnitude 7.5 earthquakes and sands and silty sands with up to 35% fines. Open symbols represent sites where surface liquefaction did not develop, and filled symbols are from sites where surface liquefaction did occur. Curves are given in the figure for varying percentage of fines that represent the boundary between the liquefaction and no liquefaction zones. Youd (1993) recommends using a factor of safety of 1.2 for engineering design based on this chart because it is possible that liquefaction may have occurred at some sites but was not detected at the ground surface.
 Watch Videos
 Solved sample problems
 Download Files
 Read also
- Critical Failure Surface
- Infinite Slope Analysis
- Effects of Water on Slope Stability
- Circular Arc Failure of Slope Analysis
- Top resources for Geotechnical Engineers
 Share
Share
Follow our official Facebook page (@civilengineeringbible) and Twitter page (@CivilEngBible) and do not miss the best civil engineering tools and articles!